
Monitoring is an important part of maintaining the reliability, availability and performance of the AWS services. AWS provides comprehensive monitoring capabilities allowing SM8 to monitor a range of metrics for an individual service/component. AWS CloudWatch will be utilised to create Alarms to monitor required metrics for individual AWS service (e.g.; RDS and EC2). SNS (Simple Notification Service) will also be utilised to create topics which individuals can subscribe to, to receive alarm notifications from CloudWatch.
This section describes the Services being monitored, the metrics, SNS topics and Alarms that have been setup to provide the SM8 with adequate capability to act when a specific alarm is triggered.
It should be noted that;
- monitoring is currently only enabled for the Production environment. Other environments (Dev, UAT and Pre-production) are deemed not mission critical. However these environments are monitored manually by viewing the Metrics using the service’s Dashboard (rather than setting up CloudWatch and SNS notifications)
- monitoring in this section describes system-level monitoring not application-level monitoring.
AWS Services Monitored
The following AWS services are considered critical to the operation of the platform and will therefore be part of the monitoring process:
- Elastic Beanstalk: All Elastic Beanstalk environments created will be monitored to ensure reliable and available environments.
- Elastic Container Service: Cluster of EC2 instances with the application (and all dependencies) deployed in Docker containers. Clusters are auto scaling.
- RDS: All RDS instances created will be monitored to ensure proper CPU and Disk Usage utilisation.
Simple Notification Service Topics
The following topics will be created to support CloudWatch alarms. Individuals who will be maintaining and servicing the Sm8rtHealh platform are required to subscribe to these topics to be notified when a CloudWatch alarm is triggered. This is important to ensure any issue is dealt with in a timely manner.
| TOPIC Name | Description |
| PROD_RDS_ALERTS | For all RDS related alarms |
| PROD_BEANSTALK_ALERTS | For all Beanstalk related alarms |
When subscribing to the above topics, Email protocol should be use
RDS Metrics and Alarms (MySQL)
The following metrics will be monitored for each RDS instance:
- CPU Utilisation: monitor high CPU usage over a specified timeframe.
- Number of DB Connections: maximum number of DB connections
- Disk Space: remaining disk space
| High CPU Utilization | 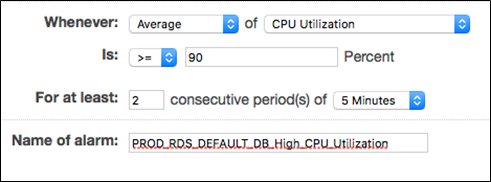 |
| High DB Connections | 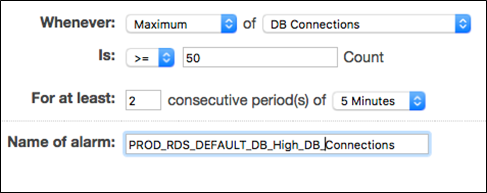 |
| Low Free Disk Storage Space | 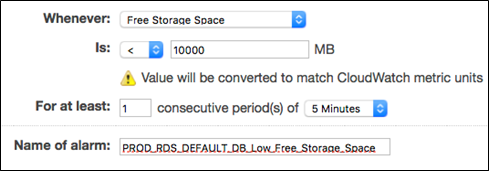 |
ECS Container Insight Metrics
The following metrics will be monitored for the Production Beanstalk environment:
- CPU Utilisation: monitor high CPU usage over a specified timeframe.
- Memory Utilisation: monitor memory utilisation of containerised applications
- Network: bytes/second
Number of Healthy Hosts: maximum number of available healthy EC2 instances
Beanstalk Alarms
The following alarms have been created for Production Beanstalk environment for the specified Metric.
| High CPU Utilization | 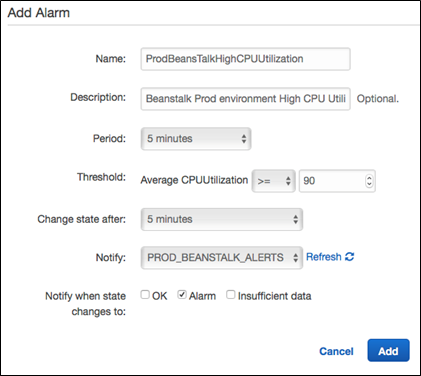 |
| Healthy Host Count | 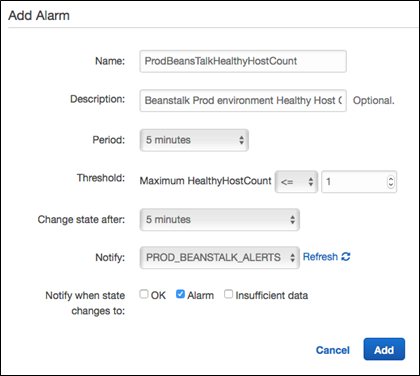 |